
Outer Banks owns the latest Nielsens as the top 10 looks fairly flat
Last week’s Nielsens had Outer Banks charging straight in at #1, and for this week we predicted:
Outer Banks looks good for the win, Virgin River should begin a downward drift, and we expect more churn, with Bosch in the firing line. General interest in the Loki story might keep it around a further week. We won’t see What If…? for another week, but we may well have missed another arrival on one of the streamers.
It turns out we weren’t too far off in terms of the perspective we took, though in other ways (ie actual specific titles) we fell a little short. We’ve still given the analytics team a pat on the back and this week they’ve had to actually draw some graphs of the Nielsen data week on week (there’s a spreadsheet). We’ll get to what it tells us later, but first…
The Nielsen data
We’re looking at the Nielsens for the week 2-8 of August. It’s US data and we’ve added columns marked with ‘*’.
| Rank | Streamer | Series | # Episodes | Ep length (mins)* | Total Minutes (Millions) | Episode Watches* |
|---|---|---|---|---|---|---|
| 1 | NETFLIX | Outer Banks | 20 | 50 | 2,100 | 42,000,000 |
| 2 | NETFLIX | Virgin River | 30 | 45 | 547 | 12,155,556 |
| 3 | NETFLIX | Cocaine Cowboys: The Kings Miami | 6 | 45 | 321 | 7,133,333 |
| 4 | NETFLIX | Top Secret UFO Projects Declassified | 6 | 45 | 288 | 6,400,000 |
| 5 | NETFLIX | Car Masters: Rust To Riches | 24 | 40 | 280 | 7,000,000 |
| 6 | NETFLIX | Love Is Blind | 14 | 55 | 236 | 4,290,909 |
| 7 | NETFLIX | The Snitch Cartel: Origins | 60 | 47 | 227 | 4,829,787 |
| 8 | NETFLIX | Hit & Run | 9 | 50 | 226 | 4,520,000 |
| 9 | NETFLIX | Lucifer | 83 | 50 | 223 | 4,460,000 |
| 10 | NETFLIX | Glow Up | 24 | 45 | 220 | 4,888,889 |
Outer Banks owns the top 10 and other big stories
At a glance, Outer Banks clocked as many minutes (over 2 billion) as the rest of the top 10 combined. In fact (we’ve done the arithmetic) the ration is 2100: 2568, but it’s not far off. The massive 2 billion+ minutes can be hard to envisage, so our guide might help. Virgin River managed around 2/3 of the previous week’s viewing, and there’s been a lot of churn with many new entrants.
It takes a moment to see another interesting story… the top 10 is entirely Netflix shows, the first time for a few months. This is likely to be a one-off as we explain below.
The shows are a mixed bunch, and, as predicted, Bosch has left the top 10.
What else happened
To some extent it’s a flat week with similar amounts of minutes and episodes across the lower end of the chart. No big bounce for Lucifer yet ahead of season 6, and we wonder if there’s a certain level most shows get in the top 20 and it’s the vagaries of measurement that push them in and out of the chart.
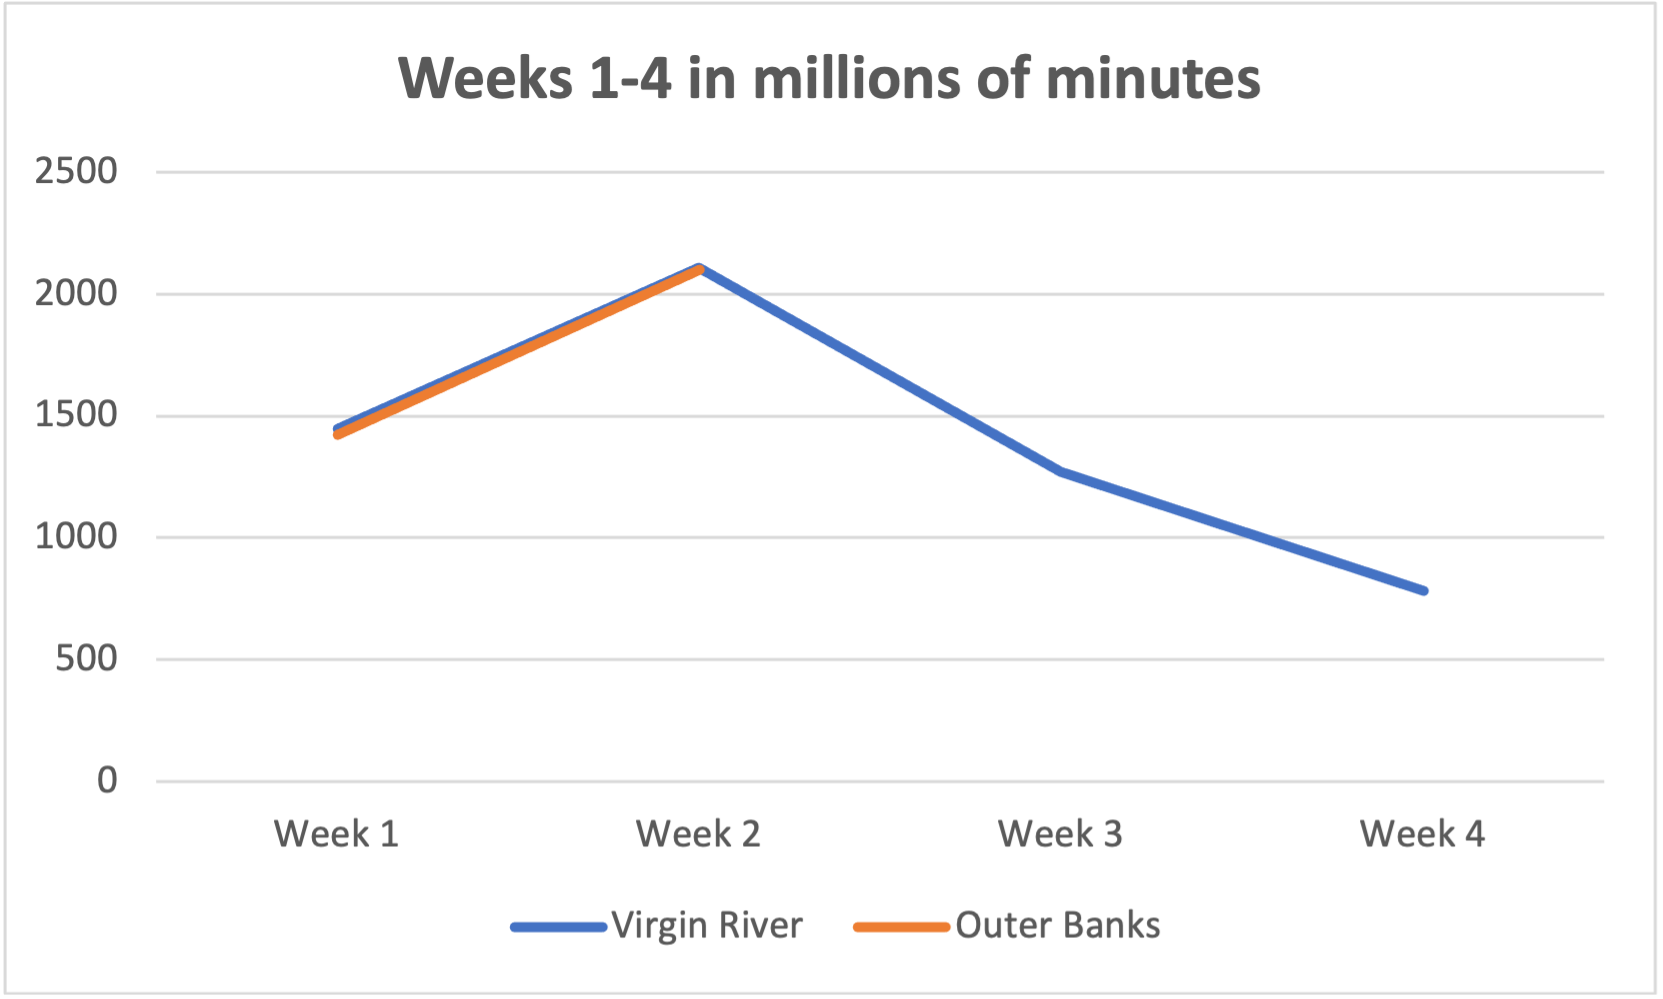
We would like to take another look at Outer Banks and Virgin River. Thanks to the power of spreadsheets (that sounded more imposing in our heads) we’ve noticed something. Here’s the numbers for the first four weeks of Virgin River and the two weeks of Outer Banks:
| Week 1 | Week 2 | Week 3 | Week 4 | |
|---|---|---|---|---|
| Virgin River | 1449 | 2109 | 1270 | 782 |
| Outer Banks | 1423 | 2100 |
These are remarkably similar (so far, and it’s only two weeks worth of data) and we wonder if the shows share a core audience. Here’s the same as a graph if you’re more picture than number oriented:
What about next week?
We predict Outer Banks to stay number 1 with round 1,200 million minutes viewed, Virgin River to drop to around 450 million and a new entry near the top for What If…? We don’t know if this will be as popular as Loki was, so we’ll estimate 650 million, in other words our top 3 prediction is:
1 Outer Banks
2 What If…?
3 Virgin River
We don’t normally get this specific, so we look to see how well we’ve done next week. We’ll add some Lucifer bounce, more churn and a surprise. See you next week!